
Latest News
2022 Start working on a new website
BBS Trading Expert
Watch the Youtube BBS video and here is a crude oil trading example
Want to know more about:
AXIOM business books awards, bronze medal! Thank You!
No longer available!
Favorite articles in 2010, 11, 12, 14 and 2015 S&C Readers' Choice Awards.

AXIOM Business Books Awards, bronze medal.

Band Break System Basic Rules
Money management
BBS - Intro - Results - Template - Basic - More_money - Selecting_stocks
Part of good money management with BBS is to use a limited selection of stocks. With a fixed, limited number of stocks it is easy to follow up the charts.
Capital Distribution
This limited selection of stocks receives an evenly distributed starting capital. Each stock will be traded individually with no profit or loss sharing with the other stocks in portfolio. This means that each stock must be handled individually, because it must only use its own private capital.
Applying this kind of money management is very effective and has a number of advantages:
- With a starting capital of $25,000, distributed between 25 stocks with each $1,000, the total loss of one stock represents a limited loss of 4% only of the total portfolio.
- A stock doing well generates maximum profits by re-investing all the profits for its own benefit.
- A stock producing bad results will have less and less capital to spend, limiting losses when things continue to go the wrong way.
- Profit of a stock doing well is not lost investing it in stocks not doing that well.
Bad performing stocks will be recognized much faster. That way they can be replaced much sooner or in the worst case they are not in the race anymore because there is no capital left.
If you are looking for more profit, you can make use of a margin account. If we run the same test as before with the 42 stocks over the period August 2004 till beginning of April 2011, with a 100% margin, BBS makes a profit of 723% with an average of 43 trades per stock backtesting with a simulated account. Compare this to the 352% profit not using any margin.
If using a margin account, do not use a margin greater than 100%. Be aware that you are investing double the money you have!
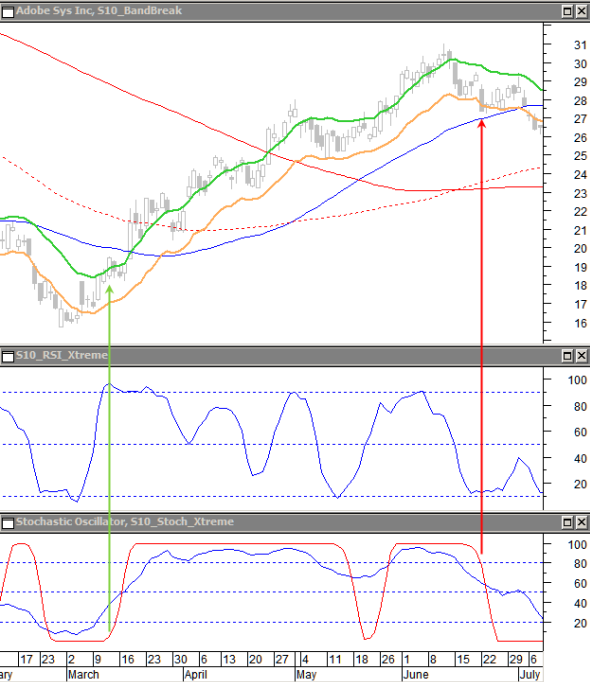
Trading Long
In the chart you can see the simple rule to open and close a long position based on BBS.
Beginning of March the closing price breaks through the upper side of the BBS channel. Time to open a long trade.
Until the end of June the closing price remains above the lower side of the BBS channel, but then breaks the lower side with a closing price. Time to close the long trade.
Trading Short
In the next chart you can see the rules to open and close a short position based on BBS.
Beginning of May the closing price is moving below the lower BBS band AND the closing price is below the 165 day simple moving average (red curve). Time to open a short trade.
Until the second half of June the closing price remains below the upper side of the BBS channel, but then breaks the upper side with a closing price. Time to close the short trade and open a new long trade.
BBS Previous chart template -Next making more money part 1
STOCATA Stocks Technical Analysis HOME
Links
Find a Stock ticker symbol, enter the ticker and find a chart, news, fundamentals and historical quotes.
Risk Disclosure: Futures and forex trading contains substantial risk and is not for every investor. An investor could potentially lose all or more than the initial investment. Risk capital is money that can be lost without jeopardizing ones’ financial security or life style. Only risk capital should be used for trading and only those with sufficient risk capital should consider trading. Past performance is not necessarily indicative of future results.
Hypothetical Performance Disclosure: Hypothetical performance results have many inherent limitations, some of which are described below. no representation is being made that any account will or is likely to achieve profits or losses similar to those shown; in fact, there are frequently sharp differences between hypothetical performance results and the actual results subsequently achieved by any particular trading program. One of the limitations of hypothetical performance results is that they are generally prepared with the benefit of hindsight. In addition, hypothetical trading does not involve financial risk, and no hypothetical trading record can completely account for the impact of financial risk of actual trading. for example, the ability to withstand losses or to adhere to a particular trading program in spite of trading losses are material points which can also adversely affect actual trading results. There are numerous other factors related to the markets in general or to the implementation of any specific trading program which cannot be fully accounted for in the preparation of hypothetical performance results and all which can adversely affect trading results.
See more 'Legal Disclosures' in the bottom menu bar!