
Latest News
2022 Start working on a new website
BBS Trading Expert
Watch the Youtube BBS video and here is a crude oil trading example
Want to know more about:
AXIOM business books awards, bronze medal! Thank You!
No longer available!
Favorite articles in 2010, 11, 12, 14 and 2015 S&C Readers' Choice Awards.

AXIOM Business Books Awards, bronze medal.

STS8 Trading Rules 5 and 6
Rule 5: Indicators start up move from low levels
The following figure complies with rule 5. To open a long position, indicators must have started an up move from low (oversold) levels.
Ideally there are positive divergences visible between the lower bottoms in price (downward red arrow) and the higher bottoms in the indicators (upward green arrows), before the buying point (vertical green up arrow).

Rule 6: Price is far from Resistance
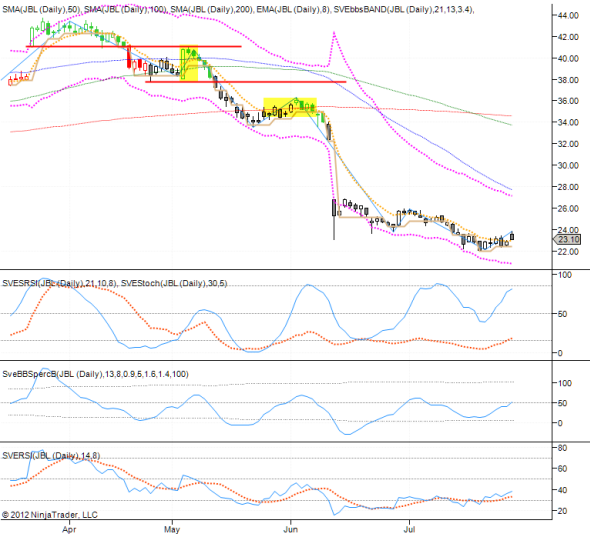
When buying signals are generated, while it looks like you are buying close to a resistance level, you are not complying to rule 6. This will typically be the case when price starts moving down after a medium to longer term uptrend. In the downtrend, buy signals are generally just smaller up corrections.
In the above figure, in the first yellow buy area there is resistance from a previous support and a bigger gap and the 50 periods average while the 50 and 100 average are slowing down.
The second yellow buy area finds resistance from the 200 periods average and close by more resistance from the 50 and 100 average moving down, and a previous support level. Too much resistance to start a long trade.
For all the basic techniques, please consult my book “Capturing Profit with Technical Analysis”, published by MarketPlace Books and available HERE
STOCATA Stocks Technical Analysis HOME
Links
Find a Stock ticker symbol, enter the ticker and find a chart, news, fundamentals and historical quotes.
Risk Disclosure: Futures and forex trading contains substantial risk and is not for every investor. An investor could potentially lose all or more than the initial investment. Risk capital is money that can be lost without jeopardizing ones’ financial security or life style. Only risk capital should be used for trading and only those with sufficient risk capital should consider trading. Past performance is not necessarily indicative of future results.
Hypothetical Performance Disclosure: Hypothetical performance results have many inherent limitations, some of which are described below. no representation is being made that any account will or is likely to achieve profits or losses similar to those shown; in fact, there are frequently sharp differences between hypothetical performance results and the actual results subsequently achieved by any particular trading program. One of the limitations of hypothetical performance results is that they are generally prepared with the benefit of hindsight. In addition, hypothetical trading does not involve financial risk, and no hypothetical trading record can completely account for the impact of financial risk of actual trading. for example, the ability to withstand losses or to adhere to a particular trading program in spite of trading losses are material points which can also adversely affect actual trading results. There are numerous other factors related to the markets in general or to the implementation of any specific trading program which cannot be fully accounted for in the preparation of hypothetical performance results and all which can adversely affect trading results.
See more 'Legal Disclosures' in the bottom menu bar!