
Latest News
2022 Start working on a new website
BBS Trading Expert
Watch the Youtube BBS video and here is a crude oil trading example
Want to know more about:
AXIOM business books awards, bronze medal! Thank You!
No longer available!
Favorite articles in 2010, 11, 12, 14 and 2015 S&C Readers' Choice Awards.

AXIOM Business Books Awards, bronze medal.

STS8 Application
Trading with STS8
The full documented STS8 manual walks through a simulated application example using the STS8 trading rules, following one stock "GT" with a starting capital of $1000. Small left overs in the calculation are for trading cost and slippage.
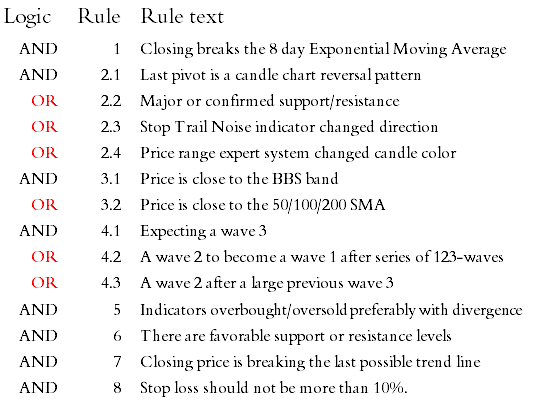
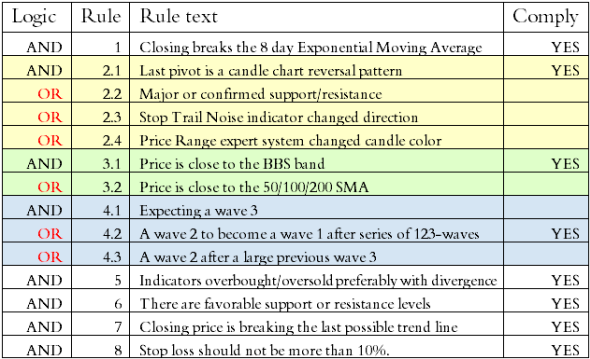
For compliance indication with the rules I will use a table to identify which rules are complied with or not, linked to each possible trading signal on the chart.
Not having to use multiple tables, I adapted the text of the rules so it is applicable both for long and short trades and opening and closing trades.
GT: Starting 07/08/2010 Buy Long
We start July 8, 2010. We have a buy long signal.
The bullish harami candlestick reversal pattern is confirmed within 3 candles. After the large and complex move down we can expect a wave 2 to become a wave 1. Buying price is $10.74 or 1000/10.74 = 93 pieces. Stop loss is set at $9.50.
GT: Ending 08/09/2011 Close last


August 9; we get immediately a very large black candle with a new top wave 3 and at the same time a low, changing the expected wave 2 to a new wave 1. Price drops in a just a few days to the S3 pivot level. This is a typical situation where taking profit is the message. We close the short trade at $11.95 the day after. The profit is: $17.17-$11.95= $5.22*176= $918.7. Our starting capital of $1000 grew to $3942 or 300% profit in one year. Even if you do not reach this amount there is a lot of room to make a very good profit applying the STS8 system!
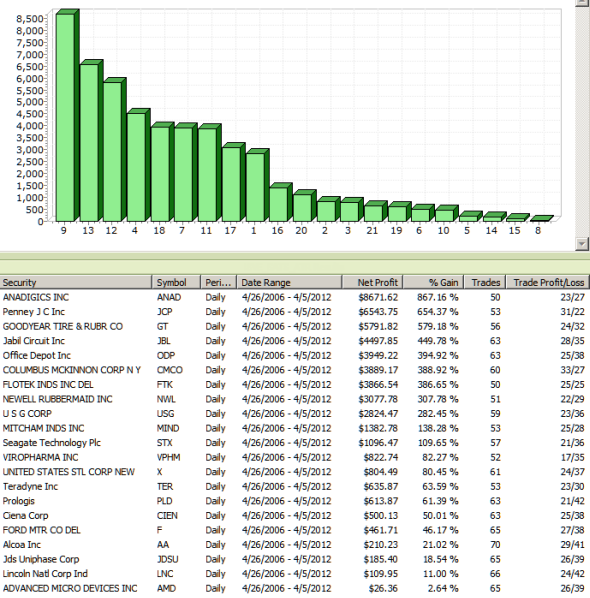
Auto-Trading SVEPREXP backtesting a simulated account.
We looked at the STS8 template with all the special indicators and the trading rules. Let me remind you that one of the indicators is an expert system (SVEPRExp) that can be used for full auto-trading via the NinjaTrader® platform and direct connection with your broker. Running a back test under the conditions and the stocks in the following figure results during the test period from May 2006 to April 2012, a period of 6 years to a profit of 238% with an average of 58 trades per stock. The starting capital was $21000 ($1000 per stock). There was no profit or loss sharing between the stocks. Trades were executed on the closing price the day of the signal.
For all the basic techniques, please consult my book “Capturing Profit with Technical Analysis”, published by MarketPlace Books and available HERE
STOCATA Stocks Technical Analysis HOME
Links
Find a Stock ticker symbol, enter the ticker and find a chart, news, fundamentals and historical quotes.
Risk Disclosure: Futures and forex trading contains substantial risk and is not for every investor. An investor could potentially lose all or more than the initial investment. Risk capital is money that can be lost without jeopardizing ones’ financial security or life style. Only risk capital should be used for trading and only those with sufficient risk capital should consider trading. Past performance is not necessarily indicative of future results.
Hypothetical Performance Disclosure: Hypothetical performance results have many inherent limitations, some of which are described below. no representation is being made that any account will or is likely to achieve profits or losses similar to those shown; in fact, there are frequently sharp differences between hypothetical performance results and the actual results subsequently achieved by any particular trading program. One of the limitations of hypothetical performance results is that they are generally prepared with the benefit of hindsight. In addition, hypothetical trading does not involve financial risk, and no hypothetical trading record can completely account for the impact of financial risk of actual trading. for example, the ability to withstand losses or to adhere to a particular trading program in spite of trading losses are material points which can also adversely affect actual trading results. There are numerous other factors related to the markets in general or to the implementation of any specific trading program which cannot be fully accounted for in the preparation of hypothetical performance results and all which can adversely affect trading results.
See more 'Legal Disclosures' in the bottom menu bar!