
Latest News
2022 Start working on a new website
BBS Trading Expert
Watch the Youtube BBS video and here is a crude oil trading example
Want to know more about:
AXIOM business books awards, bronze medal! Thank You!
No longer available!
Favorite articles in 2010, 11, 12, 14 and 2015 S&C Readers' Choice Awards.

AXIOM Business Books Awards, bronze medal.

STS8 Trading Rules 7 and 8
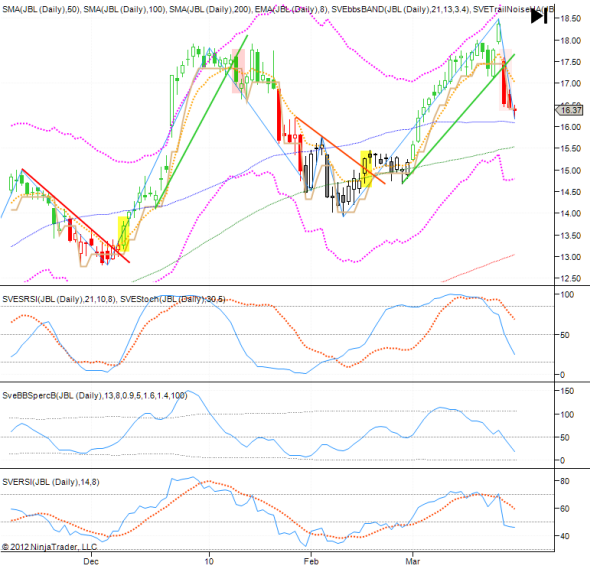
Rule 7: Closing Price Trend line Break
To comply with rule number 7 for opening a long position, price must break a last possible downtrend line.
In the next figure we comply with rule 7 in the yellow buy long areas when a last possible downtrend line (red) is broken by a closing price.
Note also the red shaded areas for opening a short position with a last green uptrend line broken.
Rule 8: Stop loss Limits the Risk
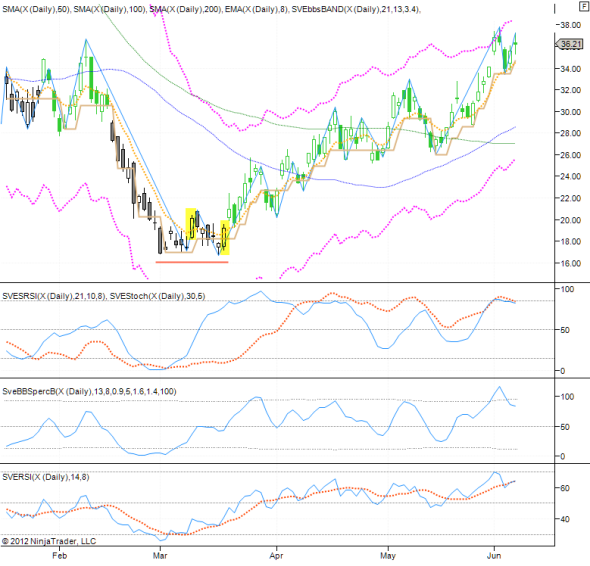
Rule 8 is related to risk management to limit possible losses. Standard for trading stocks on a daily chart, the advice is to limit the loss to 10%. However, you must use some flexibility. You might go up to 15% for low priced high volatility stocks, while for lower volatility higher priced stocks and ETFs or indexes you should lower this limit eventually to 5%.
In the above figure there is a first yellow marked buying long signal, beginning of March. But closing price minus the stop below the last low is about 20%. This is too high a risk. So, you either set a buying limit order at a lower level at around 10%, which would capture the trade here, or you wait for the next opportunity, the second yellow mark where you would have to accept 15%.
For all the basic techniques, please consult my book “Capturing Profit with Technical Analysis”, published by MarketPlace Books and available HERE
STOCATA Stocks Technical Analysis HOME
Links
Find a Stock ticker symbol, enter the ticker and find a chart, news, fundamentals and historical quotes.
Risk Disclosure: Futures and forex trading contains substantial risk and is not for every investor. An investor could potentially lose all or more than the initial investment. Risk capital is money that can be lost without jeopardizing ones’ financial security or life style. Only risk capital should be used for trading and only those with sufficient risk capital should consider trading. Past performance is not necessarily indicative of future results.
Hypothetical Performance Disclosure: Hypothetical performance results have many inherent limitations, some of which are described below. no representation is being made that any account will or is likely to achieve profits or losses similar to those shown; in fact, there are frequently sharp differences between hypothetical performance results and the actual results subsequently achieved by any particular trading program. One of the limitations of hypothetical performance results is that they are generally prepared with the benefit of hindsight. In addition, hypothetical trading does not involve financial risk, and no hypothetical trading record can completely account for the impact of financial risk of actual trading. for example, the ability to withstand losses or to adhere to a particular trading program in spite of trading losses are material points which can also adversely affect actual trading results. There are numerous other factors related to the markets in general or to the implementation of any specific trading program which cannot be fully accounted for in the preparation of hypothetical performance results and all which can adversely affect trading results.
See more 'Legal Disclosures' in the bottom menu bar!