
Latest News
2022 Start working on a new website
BBS Trading Expert
Watch the Youtube BBS video and here is a crude oil trading example
Want to know more about:
AXIOM business books awards, bronze medal! Thank You!
No longer available!
Favorite articles in 2010, 11, 12, 14 and 2015 S&C Readers' Choice Awards.

AXIOM Business Books Awards, bronze medal.

Band Break System Stocks Selection
The kind of stock we are looking for trading BBS
BBS - Intro - Results - Template - Basic - More_money - Selecting_stocks
As a trend following system, BBS profits most from stocks that make larger moves over longer periods. This stock selection is a manual process since we are anyway just looking at a limited number of stocks. If you end up with more stocks than you need for trading, just look at the daily percentage move and keep those that on average show the most and highest % values, with this formula:
(H-L)/(L+(H-L)/2)*100;
2.5;
5;
10;
We are looking for stocks that make large price moves over longer periods while avoiding stocks that have a history of:
- Little price change over longer periods
- Very high intraday volatility
- Very high daily volatility
- Regular big surprise moves
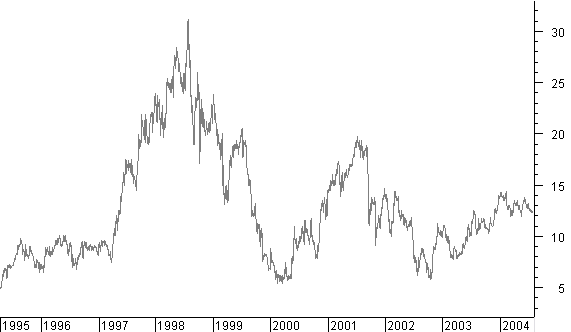
For this we will visually inspect historical price data. Here we are looking at charts until half 2004. First we look with a line chart at the long term. We want to see a steady moving price making large moves like in the figure below with the chart of AW.
Next we will look with a bar chart at the shorter term. Here we pay attention to intraday and daily volatility and absence of large surprise moves.
The next Figure shows the chart of United States Steel as an example. Here you can see that price makes larger short term moves, without extremes in volatility and without surprises. Gaps and high intraday volatility are in the direction of the short term trend and as such not a surprise.

Stocks to Avoid
Let’s have a look at some example charts with the kind of stocks we do NOT want to use with BBS. In the following figure an example of a chart with a long term flat price move.
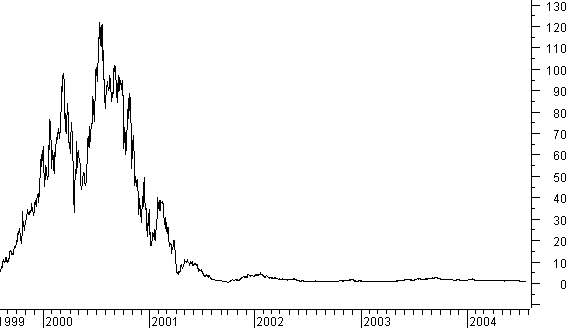
In the figure below another stock we do NOT want to use because of very extreme price moves in short time periods.

The chart of Intel in the figure below shows nice steady price moves, but looking at the price axis from year to year you will notice most of the time not enough price change to make profits.

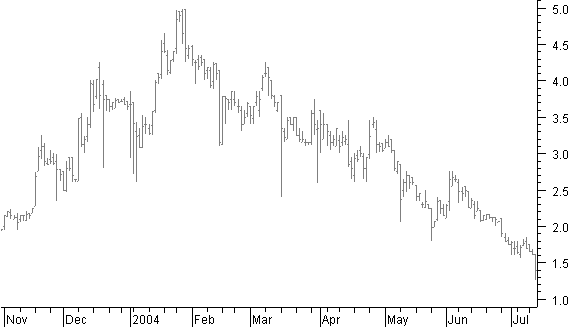
Looking at a short time daily bar chart we get a better idea how price acts from day to day. In the next figure we see typically a chart with not enough daily trading volume, showing large differences in daily volatility.

The chart of the figure below shows nice larger moves even on short term level, however there are too many single days with extreme surprise volatility. That makes it very difficult to use initial or trailing stop methods.
A good example to be used with the BBS system is AMD. The long term chart below shows nice large long term price moves with no surprises.

A finally a sample out of the AMD short term chart showing the kind of behavior and moves we like for BBS (or any trend following system).

STOCATA Stocks Technical Analysis HOME
Links
Find a Stock ticker symbol, enter the ticker and find a chart, news, fundamentals and historical quotes.
Risk Disclosure: Futures and forex trading contains substantial risk and is not for every investor. An investor could potentially lose all or more than the initial investment. Risk capital is money that can be lost without jeopardizing ones’ financial security or life style. Only risk capital should be used for trading and only those with sufficient risk capital should consider trading. Past performance is not necessarily indicative of future results.
Hypothetical Performance Disclosure: Hypothetical performance results have many inherent limitations, some of which are described below. no representation is being made that any account will or is likely to achieve profits or losses similar to those shown; in fact, there are frequently sharp differences between hypothetical performance results and the actual results subsequently achieved by any particular trading program. One of the limitations of hypothetical performance results is that they are generally prepared with the benefit of hindsight. In addition, hypothetical trading does not involve financial risk, and no hypothetical trading record can completely account for the impact of financial risk of actual trading. for example, the ability to withstand losses or to adhere to a particular trading program in spite of trading losses are material points which can also adversely affect actual trading results. There are numerous other factors related to the markets in general or to the implementation of any specific trading program which cannot be fully accounted for in the preparation of hypothetical performance results and all which can adversely affect trading results.
See more 'Legal Disclosures' in the bottom menu bar!