
Latest News
2022 Start working on a new website
BBS Trading Expert
Watch the Youtube BBS video and here is a crude oil trading example
Want to know more about:
AXIOM business books awards, bronze medal! Thank You!
No longer available!
Favorite articles in 2010, 11, 12, 14 and 2015 S&C Readers' Choice Awards.

AXIOM Business Books Awards, bronze medal.

1>2<3 Wave Counting
123Waves Intro - NEXT - Wave Indicator - Application
123 Basic wave Count
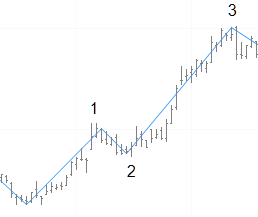
The 1>2<3 wave count is based on a number of rules and the idea that in an uptrend there are higher tops and bottoms and in a downtrend lower tops and bottoms.
Three Waves
Any up or down move should consist out of minimum 3 waves.
 |
 |
The move starts with a wave 1.
Wave 2 is a correction wave smaller than wave 1.
Wave 3 continues the move beyond wave 1.
Correction Levels
Mostly the smaller correction wave 2 will be a Fibonacci retracement between 23.6% and 50%. Larger corrections retrace to the 61.8% Fibonacci retracement level or more. A retracement between 61.8% and 100% is a warning signal that price will more easy continue past a 100% retracement, changing the direction of the move. A wave 2 retracement is valid if it does not retrace more than 100% of wave 1. |
 |
Continuation
 |
The top (bottom) of a wave 3 is considered a new wave 1 top (bottom) and therefore the start of a wave 2. We annotate consecutive higher (lower) 3 waves with an additional number to indicate that there are more wave 3 tops (bottoms) before this one.
The first top (bottom) is called wave 3.1. |
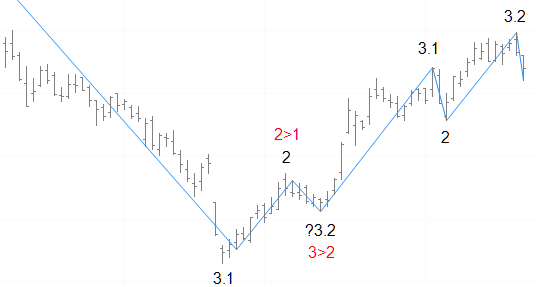
Reversals
A wave 2 correction passing beyond the start of the previous wave, is the start of a trend reversal.

Past that point we assume a trend reversal and consequently we are renaming wave 2 to wave 1 (annotated 2>1) in the opposite direction of the previous 123-move.
The exception to the rule is when a new lower (higher) level 3 is reached compared to the previous wave 3 low. In that case wave 2 is renamed to 3.x (2>3.x). Meaning the previous downtrend (uptrend) is continued and confirmed with a new lower low (higher high).
In figure the wave 2 reaction for the upper wave 3.2 is first renamed to a wave 1 when the start of the upper wave 3.2 is broken. But in the rare case where price goes further down and also breaks the low of a previous down wave, it is renamed to the new lower wave 3 (here wave 3.3).

After a new wave 3 low (high) level and a valid wave 2 correction, we expect a new wave 3 with a new lower low (higher high).
If price next turns before reaching a new lower low (higher high), we renumber the expected wave 3 to a wave 2 (3>2) and logically the previous wave 2 correction to a wave 1 (2>1). Price changes from a downtrend (uptrend) to an uptrend (downtrend).
Changing the number of a wave is of course not a problem in the case where the wave continues to move in the same direction. It offers the possibility for more profit.
Less good is a normal valid wave 2 up (down) correction followed by a wave 3 that turns before making a new low (high). Probably you have an open position in the last wave 3 direction. You must change the count once there is a valid reversal detected. This will represent mostly only a small loss.
The general idea is to trade in the direction of a wave 3 (or 1) and only as an exception in the direction of a correction wave 2.
For all the basic techniques, please consult my book “Capturing Profit with Technical Analysis”, published by MarketPlace Books and available HERE
123Waves Intro - NEXT - Wave Indicator - Application
STOCATA Stocks Technical Analysis HOME
Links
Find a Stock ticker symbol, enter the ticker and find a chart, news, fundamentals and historical quotes.
Risk Disclosure: Futures and forex trading contains substantial risk and is not for every investor. An investor could potentially lose all or more than the initial investment. Risk capital is money that can be lost without jeopardizing ones’ financial security or life style. Only risk capital should be used for trading and only those with sufficient risk capital should consider trading. Past performance is not necessarily indicative of future results.
Hypothetical Performance Disclosure: Hypothetical performance results have many inherent limitations, some of which are described below. no representation is being made that any account will or is likely to achieve profits or losses similar to those shown; in fact, there are frequently sharp differences between hypothetical performance results and the actual results subsequently achieved by any particular trading program. One of the limitations of hypothetical performance results is that they are generally prepared with the benefit of hindsight. In addition, hypothetical trading does not involve financial risk, and no hypothetical trading record can completely account for the impact of financial risk of actual trading. for example, the ability to withstand losses or to adhere to a particular trading program in spite of trading losses are material points which can also adversely affect actual trading results. There are numerous other factors related to the markets in general or to the implementation of any specific trading program which cannot be fully accounted for in the preparation of hypothetical performance results and all which can adversely affect trading results.
See more 'Legal Disclosures' in the bottom menu bar!