
Latest News
2022 Start working on a new website
BBS Trading Expert
Watch the Youtube BBS video and here is a crude oil trading example
Want to know more about:
AXIOM business books awards, bronze medal! Thank You!
No longer available!
Favorite articles in 2010, 11, 12, 14 and 2015 S&C Readers' Choice Awards.

AXIOM Business Books Awards, bronze medal.

The LOCKIT Stock Trading Application
LOCKIT is an acronym that stands for:
“Long term” what is the Long term trend?
“Open” the rules for Opening a position.
“Close” the rules for Closing a position.
“K-ratio” K-ratio or Keep risk under control and manage your money.
“Initial stop” Set an Initial stop loss.
“Trailing stop” Set a Trailing stop loss.
LOCKIT is a stock trading method based on applying technical analysis techniques and money and risk management.
Step 1: Long term trend
First we look at the long term trend. Basically we prefer to trade only in the direction of the long term trend, certainly if you are a long term trader. Even using technical analysis you will have to leave enough price reaction potential for the intermediate term to keep a stock in portfolio for the longer term.
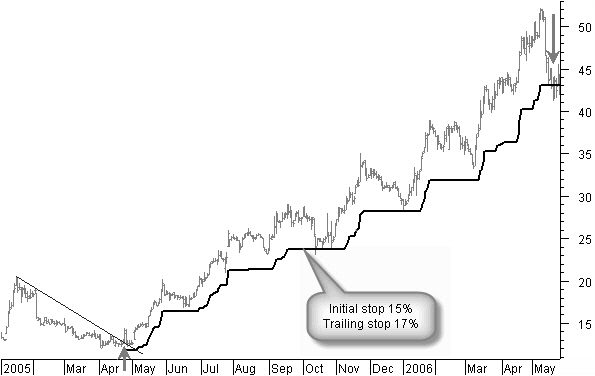
Figure 1.1: Bankrate Inc with a 17% trailing stop to stay in the trade for the long term.
Look at figure 1.1, Bankrate Inc where we have to keep a 17% trailing stop to keep us in the trade for the long term. Many times this means we will have to use an initial stop in the same order. However it is clear that we cannot permit many losing trades costing us 15% or more. It is therefore very important to have a good idea of what the long term trend is doing.
Estimating the long term trend
To estimate the long term trend for the whole of the stock market, we use a stock index. During a long term uptrend, we only trade on the long side. On the other hand we will only trade from the short side in a long term falling market.

Figure 1.2: S&P500 index monthly chart to look at the long term market trend.
We use a monthly chart (Figure 1.2) to look at the long term trend.
Remember that it is easier to make money in a rising market than in a falling market, simply because a stock can go up from $1 to $100 or 10,000%, but it can only fall from $1 to $0 or only 100%.
The use of an average on monthly prices is a first possibility to have a look at the long term trend. However, to avoid as much as possible the lagging of the average used, we will use a short 20 months exponential moving average with a zero-lagging compensation.
The long term trend is considered up as long as this moving average is going up. When this average starts moving flat or slightly downward, you can use recent price support or resistance to find confirmation for an eventual long term trend change.
In MetaStock® you can create a zero-lagging exponential moving average as follows:
You will find the formula in the book.
Additionally it is best to use trend lines and trend channels for confirmation. Because we are looking at big price moves we are using a logarithmic scale on the vertical axis. In most cases trend lines tend to accelerate on the way to a longer term target. A trend line broken by the closing price is basically a reversal signal.
The first indication of a possible trend reversal in an uptrend is a lower top compared to the last one. A confirmation you get when the next bottom is also lower than the last bottom. In a down trend, a first indication is a higher bottom than the last one. Confirmation you get with a higher top than the last one.
Looking at figure 1.2 there was possible doubt in the S&P500
long term up move in the second half of the year 1990, with the average moving down and breaking a shorter term uptrend line (not shown). A more flat correction we had in 1994, but here price remained above the uptrend line and above the last support level. Finally there is a bigger correction end 1998. But even here the price remained above the trend line and the last support line.
Of course there is also the possibility to use or combine the previous techniques with a trailing stop. Breaking this trailing stop by the closing price would basically announce the trend reversal.
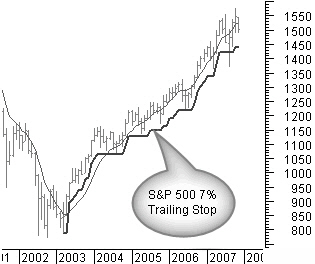
Figure 1.3: S&P500 index in the period 2003 till 2007 with a 7% trailing stop.
As a reference, look at figure 1.3, the S&P500 index in the period 2003 till 2007, the trailing stop used was 7%.
Special offer: "Capturing Profit with technical Analysis"
This is the first step in the LOCKIT system:
Find out the long term trend and take trades only in the direction of that trend.
LOCKIT Stock Trading Application Next - Part 1 - Part 2 - Part 3 - Part 4 - Part 5
STOCATA Stocks Technical Analysis HOME
Links
Find a Stock ticker symbol, enter the ticker and find a chart, news, fundamentals and historical quotes.
Risk Disclosure: Futures and forex trading contains substantial risk and is not for every investor. An investor could potentially lose all or more than the initial investment. Risk capital is money that can be lost without jeopardizing ones’ financial security or life style. Only risk capital should be used for trading and only those with sufficient risk capital should consider trading. Past performance is not necessarily indicative of future results.
Hypothetical Performance Disclosure: Hypothetical performance results have many inherent limitations, some of which are described below. no representation is being made that any account will or is likely to achieve profits or losses similar to those shown; in fact, there are frequently sharp differences between hypothetical performance results and the actual results subsequently achieved by any particular trading program. One of the limitations of hypothetical performance results is that they are generally prepared with the benefit of hindsight. In addition, hypothetical trading does not involve financial risk, and no hypothetical trading record can completely account for the impact of financial risk of actual trading. for example, the ability to withstand losses or to adhere to a particular trading program in spite of trading losses are material points which can also adversely affect actual trading results. There are numerous other factors related to the markets in general or to the implementation of any specific trading program which cannot be fully accounted for in the preparation of hypothetical performance results and all which can adversely affect trading results.
See more 'Legal Disclosures' in the bottom menu bar!