
Latest News
2022 Start working on a new website
BBS Trading Expert
Watch the Youtube BBS video and here is a crude oil trading example
Want to know more about:
AXIOM business books awards, bronze medal! Thank You!
No longer available!
Favorite articles in 2010, 11, 12, 14 and 2015 S&C Readers' Choice Awards.

AXIOM Business Books Awards, bronze medal.

MetaTrader Formulas
HOME Back to MetaTrader Formulas Overview
SVE_TEMA_haC TEMA Average on the heikin ashi price
Tema, Triple Exponential Moving Average was first introduced in Stocks & Commodities magazine February 1994 by Patrick Mulloy. Price is passed multiple times through the same filter and than combined.
TEMA = 3*EMA – 3*EMA(EMA) + EMA(EMA(EMA))
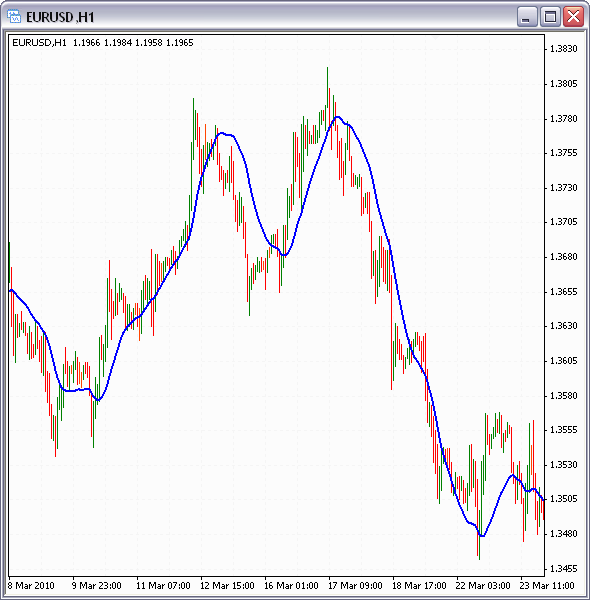
If you are looking for a better smoothing, but still with little lag using longer time periods, then the TEMA average on the heikin ashi price is for you. The blue curve in the chart is a 50-period TEMA average on the heikin ashi price, using 1 hour bars. You must include the "SVE_haC" function to calculate this indicator.
Special offer: "Capturing Profit with technical Analysis"
For MetaTrader4 you can use the following custom formula (SVE_TEMA_haC.mq4):
| //+------------------------------------------------------------------+ //| SVE_TEMA_haC.mq4 | //| Copyright © 2010, Sylvain Vervoort | //| http://stocata.org/ | //+------------------------------------------------------------------+ //+------------------------------------------------------------------+ //| A TEMA average indicator on the heikin ashi average closing price| //| You must have the indicator SVE_haC already installed | //+------------------------------------------------------------------+ #property copyright "Copyright © 2010, Sylvain Vervoort" #property link "http://stocata.org/" #property indicator_chart_window #property indicator_buffers 1 #property indicator_color1 Blue #property indicator_width1 1 //---- input parameters extern int EMA_period=20; //---- buffers double TemaBuffer[]; double Ema1[]; double Ema2[]; double Ema3[]; double TEMA1[]; //+------------------------------------------------------------------+ //| Custom indicator initialization function | //+------------------------------------------------------------------+ int init() { //---- indicators IndicatorBuffers(5); SetIndexStyle(0,DRAW_LINE); SetIndexBuffer(0,TemaBuffer); SetIndexBuffer(1,Ema1); SetIndexBuffer(2,Ema2); SetIndexBuffer(3,Ema3); SetIndexBuffer(4,TEMA1); IndicatorShortName("TEMA_haC("+EMA_period+")"); return(0); } //+------------------------------------------------------------------+ //| Custom indicator de-initialization function | //+------------------------------------------------------------------+ int deinit() { //---- return(0); } //+------------------------------------------------------------------+ //| Custom indicator iteration function | //+------------------------------------------------------------------+ int start() { int i,limit,counted_bars=IndicatorCounted(); //---- if (counted_bars==0) { limit=Bars-1; } if (counted_bars>0) { limit=Bars-counted_bars-1; } for (i=limit;i>=0;i--) TEMA1[i]=iCustom(NULL,0,"SVE_haC",0,i); for (i=limit;i>=0;i--) Ema1[i]=iMAOnArray(TEMA1,0,EMA_period,0,MODE_EMA,i); for (i=limit;i>=0;i--) Ema2[i]=iMAOnArray(Ema1,0,EMA_period,0,MODE_EMA,i); for (i=limit;i>=0;i--) Ema3[i]=iMAOnArray(Ema2,0,EMA_period,0,MODE_EMA,i); for (i=limit;i>=0;i--) TemaBuffer[i]=3*Ema1[i]-3*Ema2[i]+Ema3[i]; //---- return(0); } //+-------------------------------------------------------------------------+ |
If you create this indicator in MetaTrader, make sure you give it the name "SVE_TEMA_haC", because we will call this function by this name from other indicators that we will present further on. Please make sure you have already the indicator "SVE_haC" installed. Otherwise this indicator will not work.
Search the Internet
HOME Back to MetaTrader Formulas Overview
Links
Find a Stock ticker symbol, enter the ticker and find a chart, news, fundamentals and historical quotes.
Risk Disclosure: Futures and forex trading contains substantial risk and is not for every investor. An investor could potentially lose all or more than the initial investment. Risk capital is money that can be lost without jeopardizing ones’ financial security or life style. Only risk capital should be used for trading and only those with sufficient risk capital should consider trading. Past performance is not necessarily indicative of future results.
Hypothetical Performance Disclosure: Hypothetical performance results have many inherent limitations, some of which are described below. no representation is being made that any account will or is likely to achieve profits or losses similar to those shown; in fact, there are frequently sharp differences between hypothetical performance results and the actual results subsequently achieved by any particular trading program. One of the limitations of hypothetical performance results is that they are generally prepared with the benefit of hindsight. In addition, hypothetical trading does not involve financial risk, and no hypothetical trading record can completely account for the impact of financial risk of actual trading. for example, the ability to withstand losses or to adhere to a particular trading program in spite of trading losses are material points which can also adversely affect actual trading results. There are numerous other factors related to the markets in general or to the implementation of any specific trading program which cannot be fully accounted for in the preparation of hypothetical performance results and all which can adversely affect trading results.
See more 'Legal Disclosures' in the bottom menu bar!