
Latest News
2022 Start working on a new website
BBS Trading Expert
Watch the Youtube BBS video and here is a crude oil trading example
Want to know more about:
AXIOM business books awards, bronze medal! Thank You!
No longer available!
Favorite articles in 2010, 11, 12, 14 and 2015 S&C Readers' Choice Awards.

AXIOM Business Books Awards, bronze medal.

NinjaTrader Formulas
HOME Back to Ninjatrader Formulas Overview
Applying IRSTS Swing Trading Rules
The IRSTS seven-part series has provided the components of the indicator rules for a swing trading strategy, from color-coding candlesticks to smoothing oscillators to creating an expert system. Now that all of the components have been detailed, here's how you can put this swing trading strategy to use in your trading. This seventh and final part of my series on indicator rules for a swing trading strategy (IRSTS), I will show you how you can apply the IRSTS rules to make trading decisions. But before diving into it, I'll first review some general trading guidelines and principles. General trading guidelines
IRSTS Trading Rules
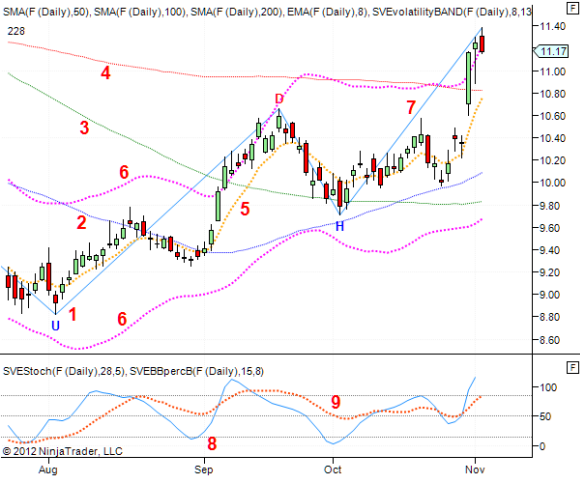
Enter a trade when these eight conditions are met:
1. The closing price breaks above or below the eight-day exponential moving average (EMA)
2. A valid candle pattern is visible at the last turning point
3. The turning point is close to the volatility band or an average
4. The expected zigzag wave is a wave 1 or 3
5. The expected price move is supported by oscillators
6. Support & resistance levels are in favor of the planned trade
7. Closing price breaks through the last possible trendline
8. The risk of the trade is within acceptable limits.
The basic Chart template
I use the following elements on my charts:
A standard candlestick chart with candlestick patterns at selected turning points
A 50-day simple moving average (blue)
A 100-day simple moving average (green)
A 200-day simple moving average (red)
A dotted orange eight-day exponential moving average (EMA)
An upper and lower volatility band (dotted magenta line)
A percentage- and volatility-adjusted high-low zigzag (light blue)
A Bollinger Band %b indicator in the lower subwindow (light blue)
A standard stochastic oscillator in the lower subwindow (dotted red).
Special offer: "Capturing Profit with technical Analysis"
A full description can be found in the Stocks & Commodities November 2013 publication. All indicators are available under the NinjaTraders formulas.
Special offer: "BBS Band Indicators" DVD
HOME Back to NinjaTrader Formulas Overview
Links
Find a Stock ticker symbol, enter the ticker and find a chart, news, fundamentals and historical quotes.
Risk Disclosure: Futures and forex trading contains substantial risk and is not for every investor. An investor could potentially lose all or more than the initial investment. Risk capital is money that can be lost without jeopardizing ones’ financial security or life style. Only risk capital should be used for trading and only those with sufficient risk capital should consider trading. Past performance is not necessarily indicative of future results.
Hypothetical Performance Disclosure: Hypothetical performance results have many inherent limitations, some of which are described below. no representation is being made that any account will or is likely to achieve profits or losses similar to those shown; in fact, there are frequently sharp differences between hypothetical performance results and the actual results subsequently achieved by any particular trading program. One of the limitations of hypothetical performance results is that they are generally prepared with the benefit of hindsight. In addition, hypothetical trading does not involve financial risk, and no hypothetical trading record can completely account for the impact of financial risk of actual trading. for example, the ability to withstand losses or to adhere to a particular trading program in spite of trading losses are material points which can also adversely affect actual trading results. There are numerous other factors related to the markets in general or to the implementation of any specific trading program which cannot be fully accounted for in the preparation of hypothetical performance results and all which can adversely affect trading results.
See more 'Legal Disclosures' in the bottom menu bar!