
Latest News
2022 Start working on a new website
BBS Trading Expert
Watch the Youtube BBS video and here is a crude oil trading example
Want to know more about:
AXIOM business books awards, bronze medal! Thank You!
No longer available!
Favorite articles in 2010, 11, 12, 14 and 2015 S&C Readers' Choice Awards.

AXIOM Business Books Awards, bronze medal.

Exploring Charting Techniques 5
HOME Back to Ninjatrader Formulas Overview
Price Projections
In part 5 “Exploring Charting Techniques” I look at techniques such as measured moves, Fibonacci projections & retracements, and daily pivots to estimate future price levels.
What is a measured move?
A measured move is a price projection based on a previous price swing. The idea behind it is that any new price swing is of approximately the same size as the previous swing. For the definition of the swings, I will use my SVEHLZZCandlepattern zigzag indicator that was introduced in my article in the July 2013 issue of Stocks & Commodities. In addition, I will use my 1-2-3 wave count as introduced in my article in the June 2013 issue of Stocks & Commodities as a reference to calculate measured moves.
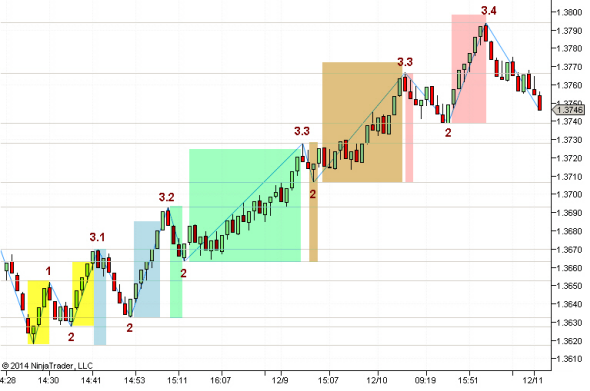
In Figure 1, you see that after a down move, a wave 1 up was followed by a first pullback wave 2 with a higher bottom. This typically indicates the start of a change in trend, in this case, a change from a down- to an uptrend. The first logical target for wave 3.1 — as it is for any wave 3 — is at least the height of the previous correction wave 2. This is because you expect a higher top than the previous top.
In general, after a new wave 1 starts, you can expect the first wave 3.1 to have at least the same height as wave 1. I have identified this on the chart in Figure 1 with yellow rectangles. Following wave 3.1 is a new corrective wave 2. After this correction a new wave 3.2 started. You can now expect a further move up with a height that is equal to (give or take 10%) the height of the previous wave 3.1. If however, the previous wave 3 is the first of the wave 3s (as it is in this case with wave 3.1), and the first 1-2-3 wave is relatively small, you can try to use the complete height of that 1-2-3 wave to determine the next move. I have identified this as blue rectangles in the chart in Figure 1.
As you can see, wave 3.2 is reached, and it is followed by a wave 2 correction and a new swing up. You next take the height of the previous wave 3.2 and use that as your projection for wave 3.3 (green). Similarly, you find the projections for waves 3.3 (brown) and 3.4 (red). Figure 2 is a continuation of the chart in Figure 1. After the top of wave 3.4 there is a valid wave 2 correction. After the correction, you would expect a new wave 3.5 up. However, price turns down again after about a 50% correction of the previous wave 2. Price reached the same level as the previous wave 2 correction, so you still have a valid wave 2 correction for wave 3.4.
Special offer: "Capturing Profit with technical Analysis"
A full description can be found in the Stocks & Commodities November 2014 publication.
Here is the code for the NinjaTrader 7 indicator SVEPivotsUTCRt.zip
Special offer: "BBS Band Indicators" DVD
HOME Back to NinjaTrader Formulas Overview
Links
Find a Stock ticker symbol, enter the ticker and find a chart, news, fundamentals and historical quotes.
Risk Disclosure: Futures and forex trading contains substantial risk and is not for every investor. An investor could potentially lose all or more than the initial investment. Risk capital is money that can be lost without jeopardizing ones’ financial security or life style. Only risk capital should be used for trading and only those with sufficient risk capital should consider trading. Past performance is not necessarily indicative of future results.
Hypothetical Performance Disclosure: Hypothetical performance results have many inherent limitations, some of which are described below. no representation is being made that any account will or is likely to achieve profits or losses similar to those shown; in fact, there are frequently sharp differences between hypothetical performance results and the actual results subsequently achieved by any particular trading program. One of the limitations of hypothetical performance results is that they are generally prepared with the benefit of hindsight. In addition, hypothetical trading does not involve financial risk, and no hypothetical trading record can completely account for the impact of financial risk of actual trading. for example, the ability to withstand losses or to adhere to a particular trading program in spite of trading losses are material points which can also adversely affect actual trading results. There are numerous other factors related to the markets in general or to the implementation of any specific trading program which cannot be fully accounted for in the preparation of hypothetical performance results and all which can adversely affect trading results.
See more 'Legal Disclosures' in the bottom menu bar!