
Latest News
2022 Start working on a new website
BBS Trading Expert
Watch the Youtube BBS video and here is a crude oil trading example
Want to know more about:
AXIOM business books awards, bronze medal! Thank You!
No longer available!
Favorite articles in 2010, 11, 12, 14 and 2015 S&C Readers' Choice Awards.

AXIOM Business Books Awards, bronze medal.

Replies to YouTube Questions
September 9, 2009. Price Trend Reversal Patterns
I have noticed a head and shoulders pattern formed within the last 2 weeks at the citybank shares check it out! :D Tell me if its valid plz.
REPLY:
This is the daily chart of CBTK up to September 9, 2009:
Special offer: "Capturing Profit with technical Analysis"
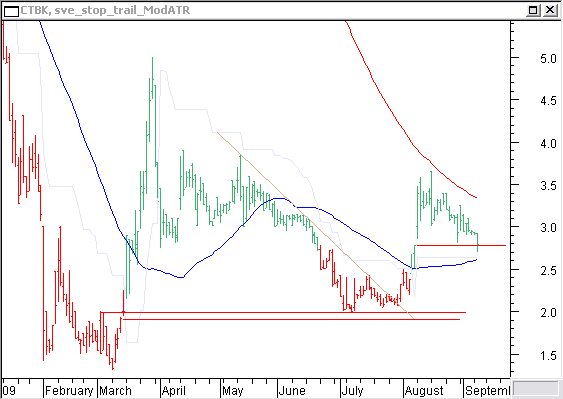
I do not see this as a head-and-shoulder. I would like to see a H&S at a bottom or top for a reversal. I would rather see the last bottom as a double bottom pattern that was confirmed when it broke the last brown downtrend line. That was also the right buying moment. There was good support from a previous resistance and from a small window in march. That would have allowed an acceptable initial stop setting. Now I would wait for the turning point with the idea that price should stay above the 50-day moving average (blue) and eventually even above the last window support. So with a closing price staying above $2.45 and price turning up I would buy. Do not forget to keep an initial stop and make sure you have a good risk-to-reward ratio. Also, never open a position based on just one technical indication!
Have a nice day.
Back to YouTube videos starting page
STOCATA Stocks Technical Analysis HOME
Links
Find a Stock ticker symbol, enter the ticker and find a chart, news, fundamentals and historical quotes.
Risk Disclosure: Futures and forex trading contains substantial risk and is not for every investor. An investor could potentially lose all or more than the initial investment. Risk capital is money that can be lost without jeopardizing ones’ financial security or life style. Only risk capital should be used for trading and only those with sufficient risk capital should consider trading. Past performance is not necessarily indicative of future results.
Hypothetical Performance Disclosure: Hypothetical performance results have many inherent limitations, some of which are described below. no representation is being made that any account will or is likely to achieve profits or losses similar to those shown; in fact, there are frequently sharp differences between hypothetical performance results and the actual results subsequently achieved by any particular trading program. One of the limitations of hypothetical performance results is that they are generally prepared with the benefit of hindsight. In addition, hypothetical trading does not involve financial risk, and no hypothetical trading record can completely account for the impact of financial risk of actual trading. for example, the ability to withstand losses or to adhere to a particular trading program in spite of trading losses are material points which can also adversely affect actual trading results. There are numerous other factors related to the markets in general or to the implementation of any specific trading program which cannot be fully accounted for in the preparation of hypothetical performance results and all which can adversely affect trading results.
See more 'Legal Disclosures' in the bottom menu bar!